


Marketing Analytics: What you need to know about KPIs, Tools and Dashboards
Let us look into Dating Pro Enterprise package more closely today — to be precise, to learn more about one of the most important aspects of every business — analytics and tools that are used to gather the data.
Key Performance Indicator (KPI) – is a specific indicator which affects all decisions made in marketing, sales, product development and so on. Depending on what decision we want to make, it’s important to determine what indicators we need to look at, and their quality.
There is a huge number of indicators that can be analyzed and taken into account when creating a business development plan or evaluating the current economic plan. It’s up to you to decide which of them to put in priority, but you need to know the key indicators by heart if you want to be successful.
Now let’s talk more about the KPIs, how to analyze them and what you should know about them.
First of all, key indicators of the dating market are divided into marketing performance, sales performance and users performance. Let us look closer at each one of them, highlight the main points and learn how we work with them in the Enterprise package.
Marketing metrics
1. Unique Visitors
This is a user with unique characteristics that visited your site during a certain period of time (usually 1 full day). Most often, under the unique characteristics, we understand several parameters: registration data, browser, IP address, location and etc.
By measuring the number of unique visitors from each marketing channel, you can also measure the effectiveness of all your marketing campaigns and actions. And although an increasing number of unique visitors per month is an excellent indicator, do not forget to look at the engagement indicators, such as the average time on the site, the average number of pages visited, repeat visits, email subscriptions, and other similar metrics. These metrics will tell you about the quality of your traffic, which is no less important than quantity.
Over what period do I need to check it: last 30 days
What services can be used: Google Analytics
2. Signups
One of the main goals of marketing is to increase signups, There a lot of different ways to force your site visitors convert to site members.
Over what period do I need to check it: yesterday & past 7 days
What services can be used: Google Analytics
3. Organic vs. Paid Traffic Rate
Organic traffic comes from your organic search engine rankings, while paid traffic comes from pay-per-click advertising (PPC), sponsored links, or bought advertisements.
Organic search is usually better because it’s a)free. b)more trusted by the searchers and c)clicked 8 times more often. But there are downsides too: it’s a lot harder and more time consuming to grow organic traffic and usually has a bit lower conversion rate than paid clicks.
If you have a budget and want to achieve fast results — PPC ads are for you.
And if you can do both, do both.
Over what period do I need to check it: past 30 days
What services can be used: Google Analytics
Sales metrics
1. Conversion Rate to Customer
The name of the KPI says for itself – how many and % site members converted to paying members. It doesn’t matter whether they paid 99 cents or 999 dollars.
How to calculate = number of paid users / number of registered users * 100
For example — 10 (paid users) / 100 (registered users) * 100 = 10% conversion rate
Over what period do I need to check it: yesterday & past 7 days
What services can be used: CRM system
2. Average Revenue Per Account (ARPA)
Also know as ARPU (Average Revenue per User or per Unit) — is a metric that shows you how much a particular customer spends on your service every month. Calculating the average bill, you will be able to determine the preferences of certain groups of customers who have made a purchase over the past month.
Tracking ARPUs leads to better planning in both the short and long term. On one hand, this metric helps to increase MRR (monthly recurring revenue), as you identify the most likely paying customers. On the other hand, ARPU contributes to your LTV (life time value) goals, indicating the most optimal path to successful development in the future.
ARPU = Revenue / Users
Over what period do I need to check it: past 7 days & past 30 days
What services can be used: Manual calculations
3. Monthly Recurring Revenue (MRR)
MRR is the total monthly income received from your subscribers. ARR (Annual Recurring Revenue) is a similar indicator, but for annual income. Tracking these two values is useful for short and long term planning.
For example, say you have 5 customers. Three of them are paying $10/month, one is paying $20/month and one is paying $100/month. MRR in this example is $150 ((3 x $10) + $20 + $100).
But despite seemingly easy math, one needs to keep track of several MRRs:
- New MRR – MRR that you received from new customers;
- Add-on MRR – MRR from current customers (due to switching to a more expensive tariff);
- Churn MRR – MRR that you lost due to customers switching to a cheaper package or when the user canceled (or did not renew) the subscription.
Over what period do I need to check it: past 30 days
What services can be used: Manual calculations
4. Customer Acquisition Cost (CAC)
CAC is the total amount of all marketing efforts that were required to attract one customer. This is one of the determining factors of whether your company has a viable business model that can maintain a low CAC level when scaling up a business.
In order to correctly calculate this figure, it is necessary to add the costs of marketing, sales and advertising for a certain period of time, and then divide the result by the number of new customers.
Over what period do I need to check it: past 30 days & past year
What services can be used: Manual calculations
Customer metrics
1. Net Promoter Score (NPS)
NPS shows how many supporters or promoters a company has. Those are people willing to recommend a company to their friends, family, and acquaintances. It is calculated using the responses of the real site clients – those who used the services.
NPS typically uses the 0-10 scale, where 0 means they will never recommend, and 10 means they definitely will. The higher your NPS, the better, because it indicates satisfied users who are likely to stay with you over time.
Over what period do I need to check it: past 30 days
What services can be used: NPS surveys
2. Active Users
From the name, these are users who are active on your site/app. This metric shows how healthy your platform’s user base is. Usually, active users are those who didn’t just log in, but browse profiles, message and leave comments.
Active users can be measured as Daily active users (DAU), Weekly active users (WAU), or Monthly active users (MAU) over corresponding time periods. Improving in these indicators is a good signal that your business is moving in the right direction. These numbers can help you determine the impact of key points, including new marketing channels, sales approaches, and product improvements.
Over what period do I need to check it: yesterday, past 7 days, past 30 days.
What services can be used: Google Analytics
3. Customer Retention Rate
Retention metric is the company’s ability to maintain long-term customer relationships. A high score means that your customers are happy to come back for a new purchase and recommend you to their friends. Work with retention starts from the first contact between you and your client and, ideally, never ends.
Over what period do I need to check it: past 30 days.
What services can be used: Google Analytics
4. Churn
Churn is an indicator of the lost resources over a given period of time. In marketing, the concept of churn refers to customers who have left the company/platform and is usually expressed as a percentage or monetary value. For example, if your churn rate is 5%, then this means that every month your active client base is reduced by 5%.
The formula for calculating is simple:
Lost resource / Number of resources at the beginning of the period
Supposedly at the beginning of the month, there were 100 customers on your site, and by the end of the month 5 of them were gone (they stopped using the site, unsubscribed, changed the tariff, etc.), then the churn rate is: (5 customers / 100 customers) * 100 = 5% churn
Important note: the calculation does not need to take into account new users who have become your customers during this time.
Over what period do I need to check it: past 30 days.
What services can be used: Google Analytics
5. Customer Lifetime Value (LTV)
LTV is an indicator of the total profit that the company receives from the client over the period of their cooperation. LTV shows how much money you can spend to attract 1 new customer. So, if the cost of attracting a single customer, or CAC (customer acquisition cost) is $ 100, and client’s life cycle is $ 500, then imagine that you seemed to have printed 400 bucks. Not bad, huh?
The higher the LTV and the lower the CAC, the faster your profit will grow.
LTV = ARPU / User Churn
E.g. ARPU is $100 and Churn is 5% — 100 / 0.05 = $2000
Over what period do I need to check it: past 30 days.
What services can be used: Manual calculations
Dashboards
So know you have a bunch of key indicators you need to check from time to time. “But how should I track them all as they are in different tools??” — you may ask and you’ll be correct, tracking all of them would take some effort and time.
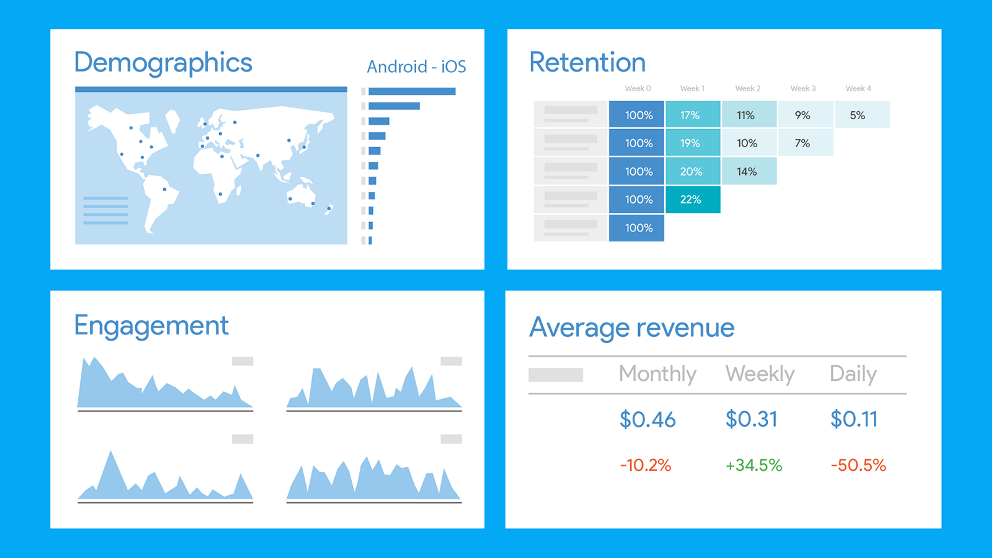
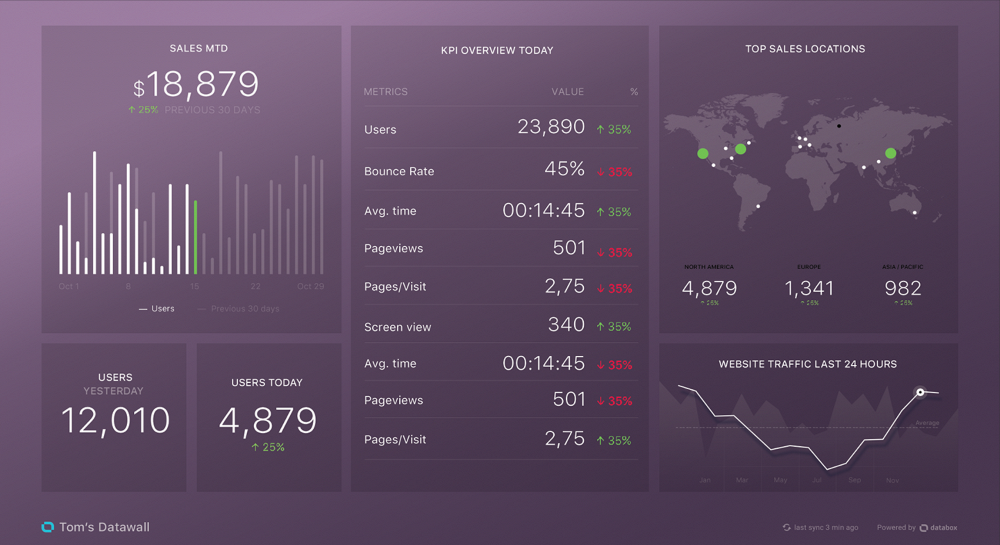
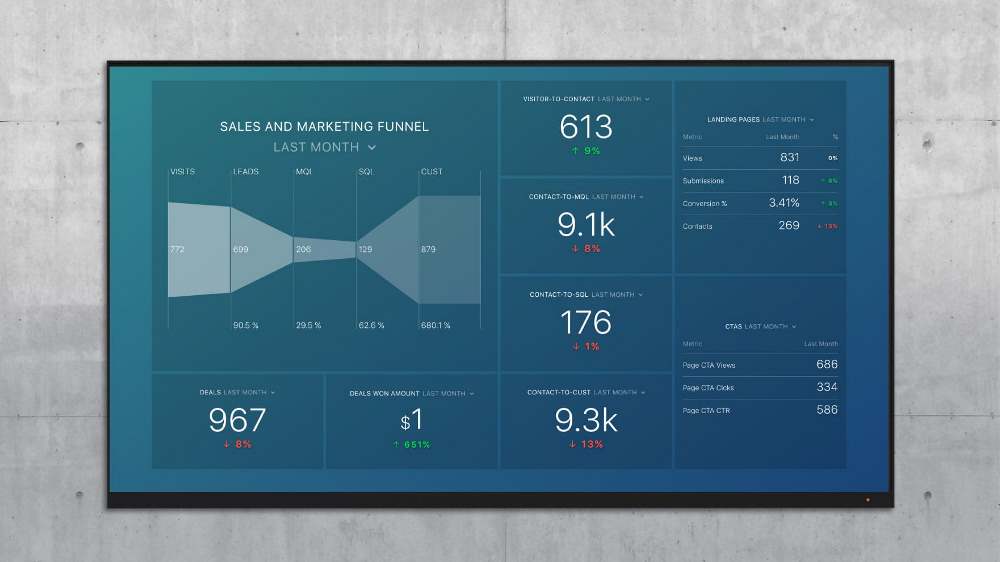
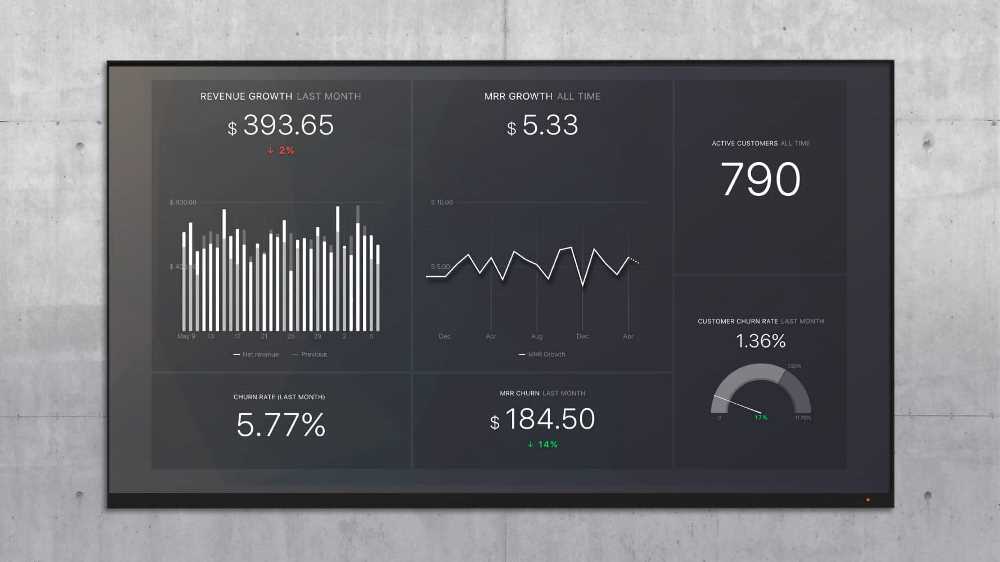
This is why, in the Enterprise package, we use a dashboard system from Databox:
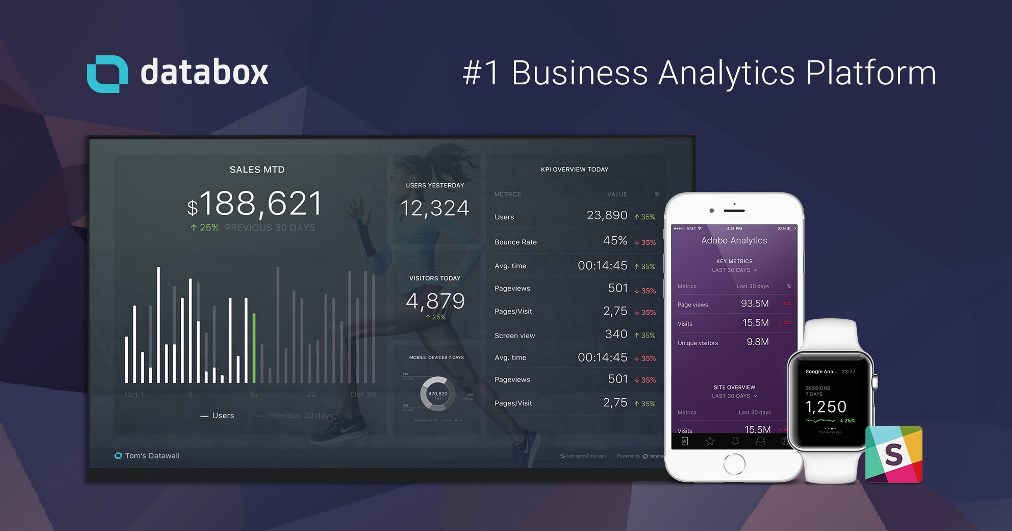
With Databox you can gather all dispersed KPIs in one place and access the data from any device (mobile phone, computer, Apple Watch, Slack). Databox can be integrated with several hundred analytics services out of the box. There is also an option to set up daily or weekly scorecards or define a set of alerts for some of your KPIs.
Conclusion
As you can see, when analyzing key marketing and sales data for your company/site, a number of nuances must be taken into account. It is obvious that not all of these indicators can be applied in all niches and situations so we will need to determine what are the most important KPIs for you to be successful, profitable and be able to scale in future.
The growth in KPIs means growth in revenue and in your business altogether.
You can learn more about Dating Pro Enterprise package here